
stream
Define a vector space with words
I've been experimenting with embedding ideas into GPT-space, and using the resulting vectors to visualize.
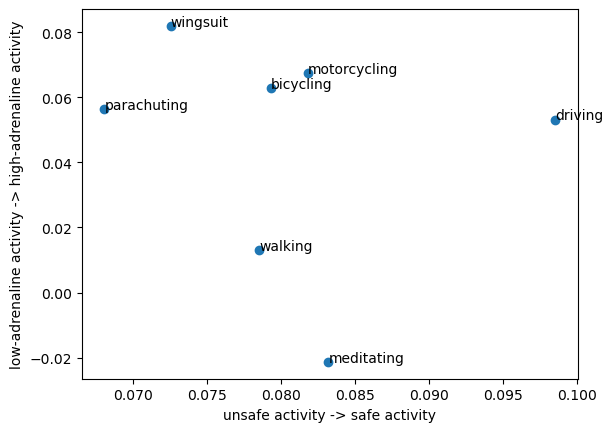
For example, you could plot different activities based on two axes: how safe they are, and how adrenaline-inducing they are.
How does it work?
The intuition is the following. In words, you can define an axis, e.g. "unsafe activity" -> "safe activity". You can turn that into a numeric axis by converting each point -- let's call them the low anchor and high anchor -- into the embedding space, giving you the anchor points a1 and a2. (The vectors have length 1536, for the OpenAI ada-002 model.)
The vector a2-a1 defines an axis. Given a query string, e.g. "parachuting", we can convert that into a vector q in the embedding space. Projecting it onto our axis, we get a single number: q_score = np.dot(q, a2-a1). (It's equivalent but a bit more convenient to normalize the axis by diving a2-a1 with its L1-norm.)
That's it! Let's check a few examples to see if they make intuitive sense. The original safety and adrenaline example is directionally correct, but I would probably reorder at least some of the things.
- Wingsuiting is more dangerous than parachuting.
- Driving is more safe than meditating and walking.
- I hope for most people parachuting is higher-adrenaline than driving?
Through my experimentation I realized that embedding a word in isolation might lack the Context needed to make a judgment, so I decided to embed each datapoint in the context of that axis. So in the original example, to get the horizontal axis value for "bicycling", I embed it with context: "how safe is bicycling". For the vertical axis, no context seemed to work better.
Here's a fruity example:
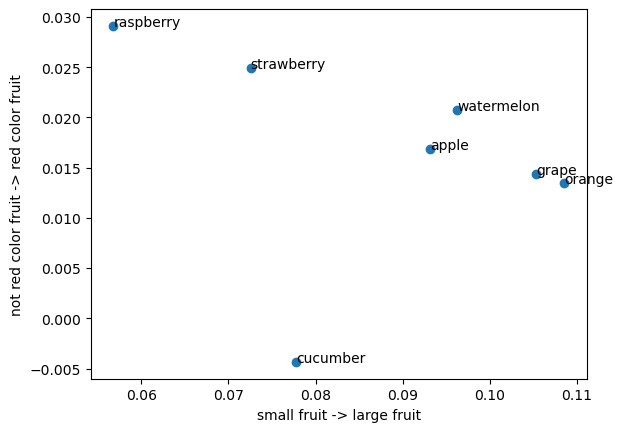
I think the color axis is quite good. But the size axis is pretty weak: grapes and oranges are definitely not larger than watermelons.
Another example to test robustness. Here, the US-statehood axis should yield a bimodal outcome, because statehood is binary:
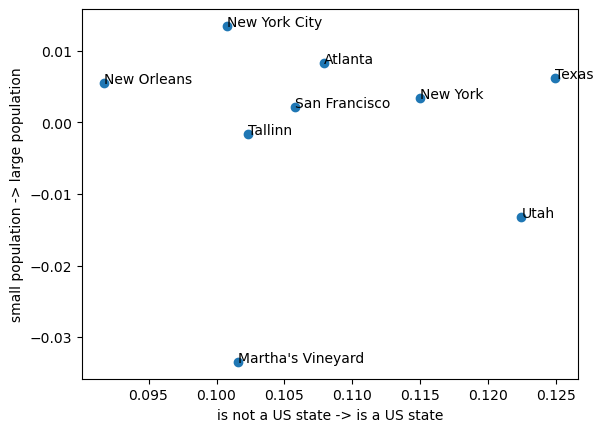
The horizontal axis is good: Texas, New York, and Utah are all states and the rest are not; you could make a perfect classifier using simple thresholding. For the vertical axis, I used ChatGPT to retrieve the populations:
- New York City: 8.8 million
- Atlanta: 498,715
- New Orleans: 390,144
- Texas: 29.1 million
- New York: 20.2 million
- San Francisco: 883,305
- Tallinn: 442,064
- Utah: 3.27 million
- Martha's Vineyard: 16,535
The locations correlate somewhat to reality, but there are glaring errors -- Texas getting ranked close to New Orleans is a pretty obvious error.
Based on this simple experiment I'd say there is value in using this sort of basis transform for strings, but probably not for simple fact questions, and not when the user has high expectation of accuracy. In addition, the examples above are somewhat cherry-picked because I manually tuned the axis context for each plot 1-3 times.
The technical approach could probably be improved, though. I am generally optimistic on what one could do -- but engineering this approach to be better probably depends on the use case.
As seems to be recently, my take on the capability of these sorts of GPT-based methods is: highly capable, but needs engineering to make it work.