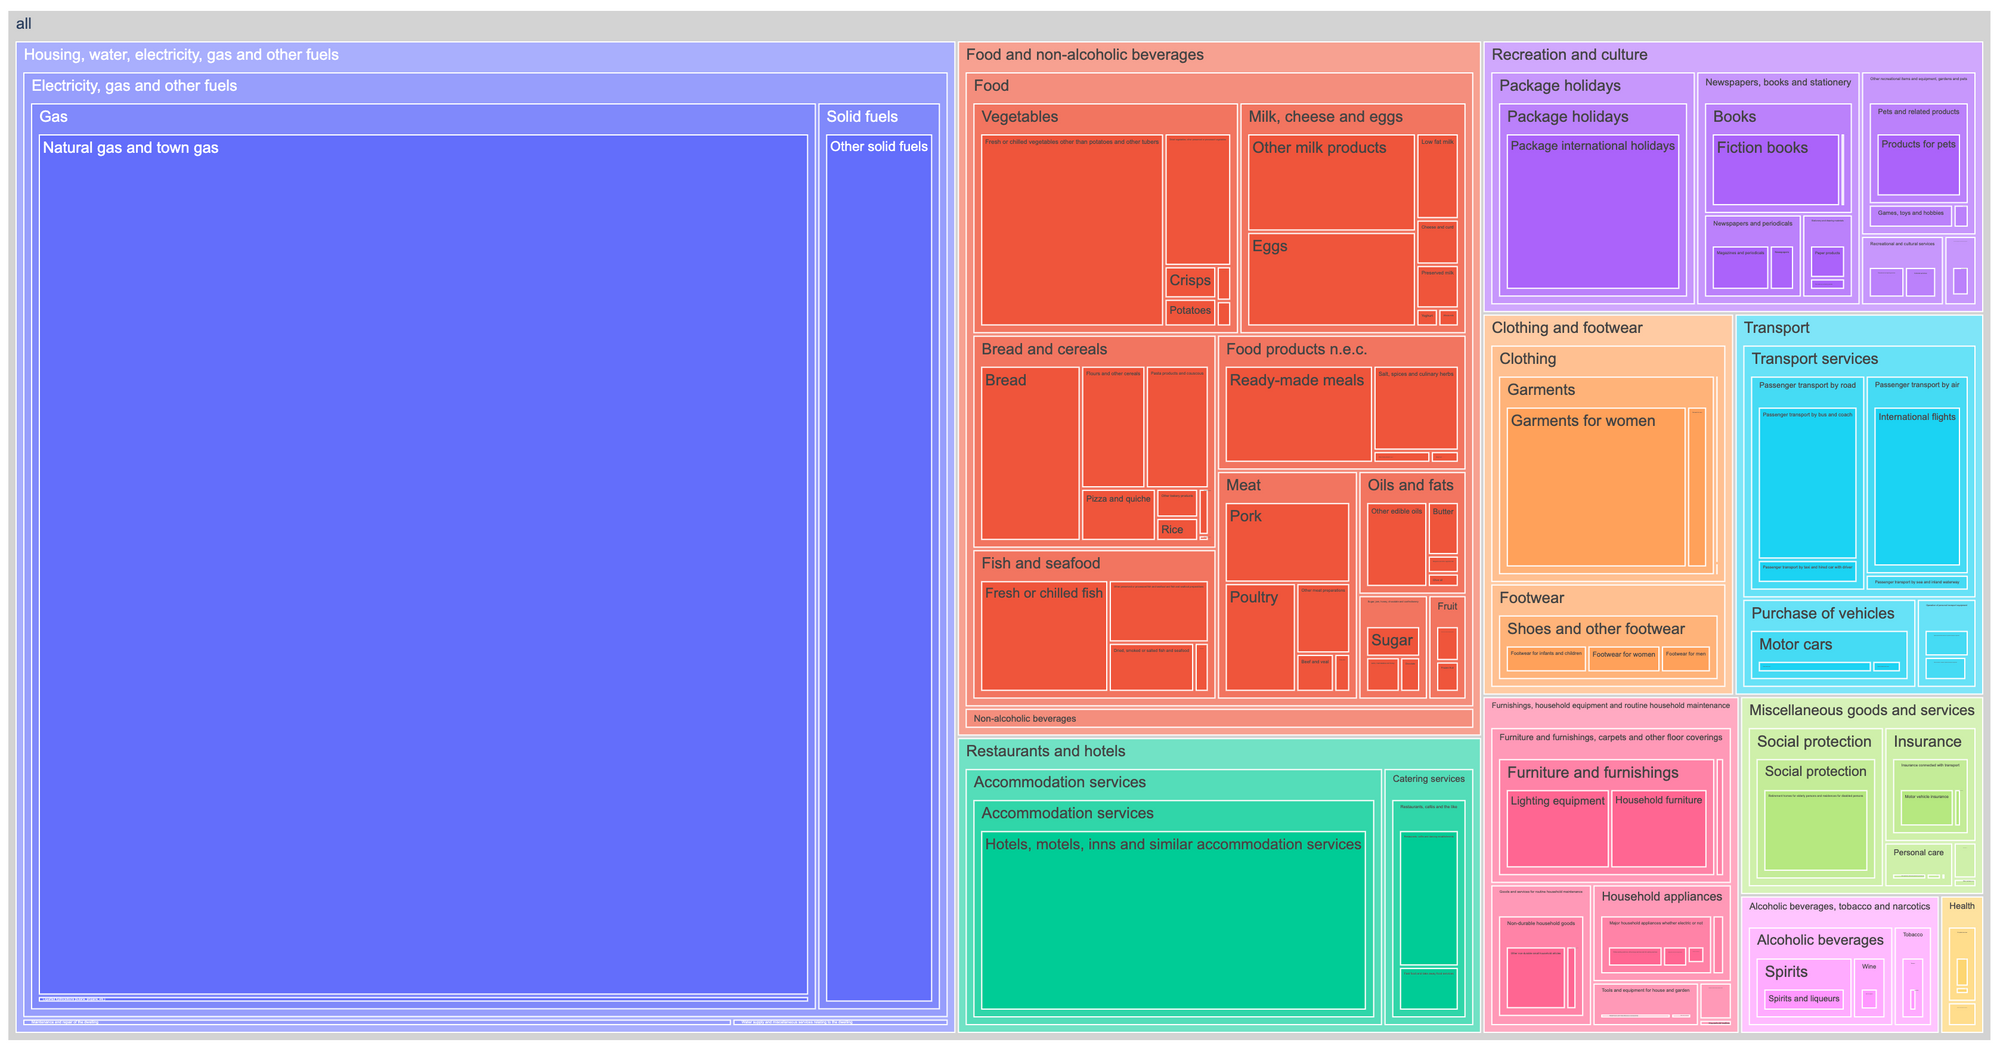
20.1% yearly inflation in Estonia
What did Estonians start paying more for in April 2022?

There's rampant inflation in Estonia. Eurostat estimated the yearly growth in consumer prices at 20.1% in the 12 months leading up to May 2022.
Why? Tyler Cowen posed the same question in his blog. I can kinda-sorta point at an answer because I live in Tallinn and have seen massive increases in energy prices recently, and hear daily news about downstream effects on all kinds of businesses. But I didn't have a good grasp on what exactly has gotten more expensive.
So I visualized a breakdown of cost-of-living increases. Eurostat puts together a granular basket of goods whose tracks price movements it tracks. For example, it has separate entries for
- CP01111 Rice
- CP01115 Pizza and quiche
- CP03122K Ladies bikini (1 set)
- et cetera
At this level of detail, it is hard to understand the big picture. On the other hand, saying that the category "CP01 Food and non-alcoholic beverages" has gotten expensive is not very informative.
Treemaps are a great solution for displaying hierarchical detail, so that's what I used. The figure below shows where additional spend in the month of April 2022 came from, for a typical consumer. Intuitively, this chart answers the question:
What did Estonians start paying more for in April 2022?
Here's the interactive chart where you can zoom in yourself, and see monthly data going back to August 2021. And here's a short video of it if you can't be bothered to click:
What does this chart show, exactly?
- The area of each category of goods corresponds to how many extra euros a typical consumer had to spend on it on April 30, compared to April 1.
- When you hover over a box, the
valshown corresponds to a monthly budget increase in that category, for someone with a total monthly budget of 1,000€. - This is calculated from the basket weights and the category's monthly inflation: if 25% of your 1,000€ monthly budget is spent on food, and food prices increased 2.4% in April, then the chart will show
25% * 1000€ * 2.4% = 6€as the budget increase for food. Previously you spent 250€ on food every month, now you spend 256€ every month. - The chart shows the 6€, not the 256€, so it does not show a monthly breakdown of the basket; rather it breaks down the increase in basket costs.
Some caveats:
- If the price of a category of goods went down in a month, this is not plotted (it's hard to intuitively convey negative values on a treemap).
- The Eurostat-provided totals for a month don't quite match the bottom-up sums I calculate. I think this is because of a) rounding errors in the input data, and b) I ignore negative index changes. I don't understand this well; that probably means there are errors up to 30-40% in my calculations.
- If you want to see how Eurostat calculates the price index, see their HICP manual (Chart 3.1 on page 38 is a good overview).
And if you're interested, the code is on Github: taivop/inflation.
